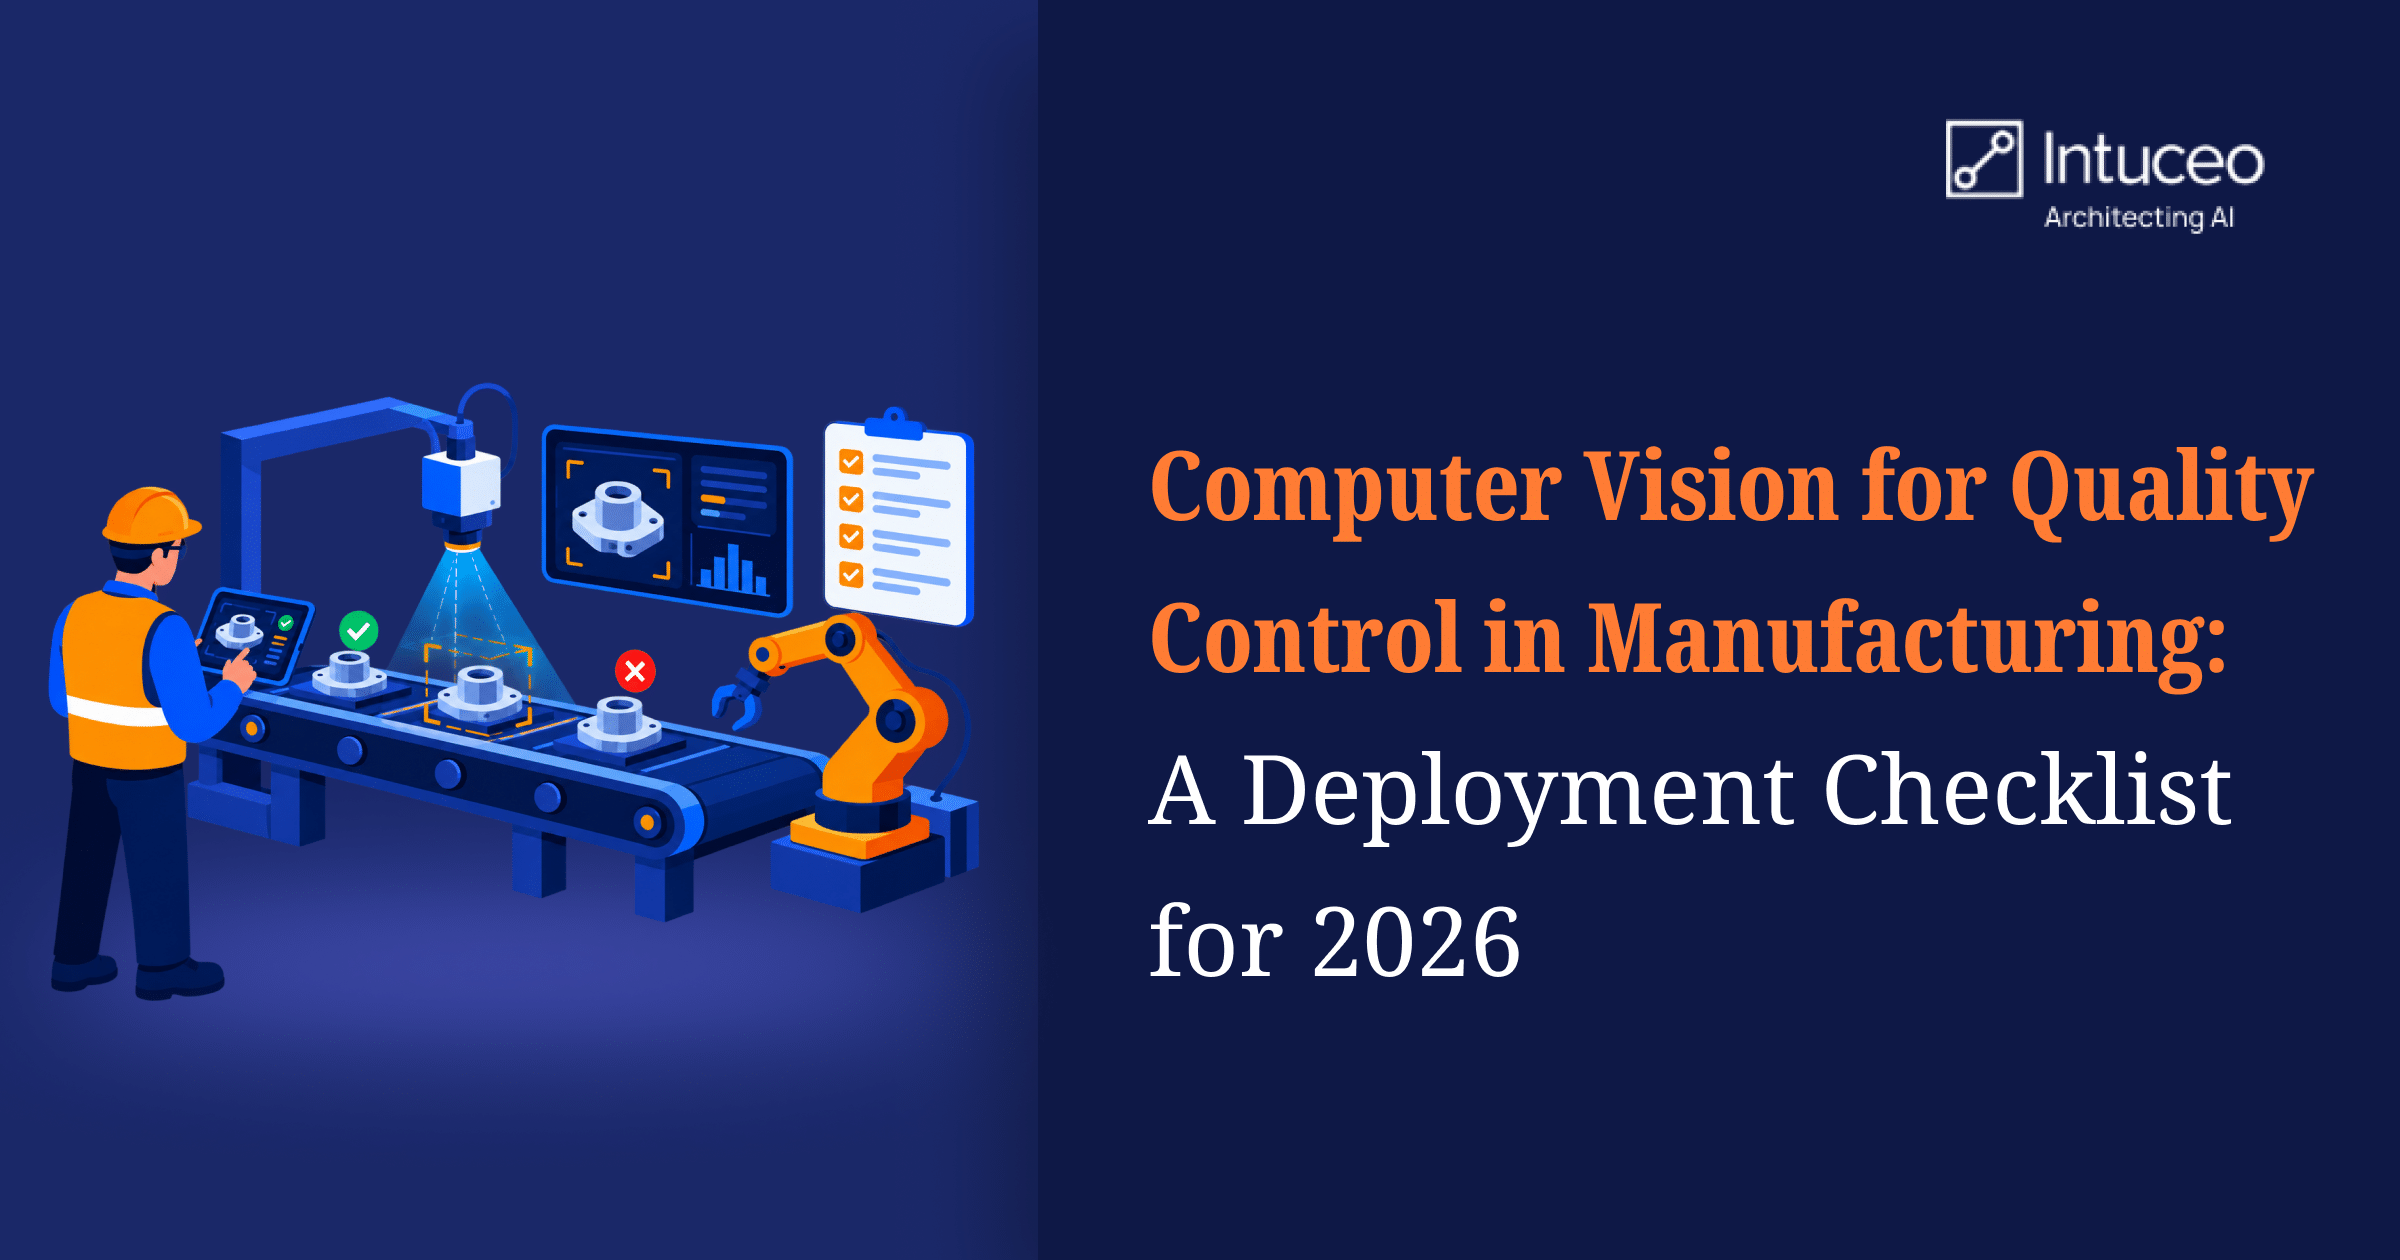
Quality escapes rarely announce themselves on the inspection line. They surface later as returns, warranty claims, containment actions, and a customer relationship that cools a degree at a time. For manufacturers running high-mix lines across Florida’s aerospace, defense, medical device, electronics, and marine sectors, catching defects earlier has moved computer vision quality control from pilot curiosity to a line-of-business decision.
The state gives the question real weight. Florida employed roughly 430,000 people in manufacturing as of mid-2026, [1] much of it in small and mid-sized plants where a poorly run rollout is a costly detour. For those operations, the discipline of the deployment matters more than the brand of camera on the bracket.
What follows is a working computer vision quality control checklist. A buyer can use it to run a deployment and to judge a vendor’s rigor; a vendor can treat it as a delivery standard.
Key Takeaways
- Imaging, labeled data, and integration decide most outcomes, not model choice.
- Use supervised detection for known defects and anomaly detection for rare or new ones.
- ROI comes mainly from escapes avoided, then from scrap and rework savings.
- Price labeling, revalidation, and retraining over the system's life, not at go-live alone.
What Is Computer Vision Quality Control, and What Does It Change?
Computer vision quality control is the use of cameras, controlled lighting, and trained Artificial Intelligence (AI) models to inspect every part on a line and trigger a pass, reject, or alert in real time. An AI visual inspection system does not replace a quality program; it changes where and how consistently the program catches problems. A camera captures each part, a trained model scores it against the definition of a good unit, and the line acts on that score in real time rather than at a sampling gate hours later.
The value is consistency. Trained human inspectors are estimated to miss defects in 20 to 30 percent of cases, with performance varying by experience, fatigue, and how often a given defect actually appears. [2]
Automated visual inspection holds one standard across every part and every shift, and it produces a record of each decision that a manual gate cannot.
Two capabilities carry most of the load on the floor.
Defect detection AI trained on labeled examples handles the faults you can describe and show, while anomaly-based models flag parts that simply deviate from normal, including defect types no one has catalogued yet. Together they give machine vision quality assurance a reach that rule-based optical inspection, manually tuned for each condition, struggles to match. Classical Automated Optical Inspection (AOI) still fits stable, well-lit, unchanging parts, but it needs manual reprogramming whenever a part or a defect shifts, which is precisely where trained models earn their place on mixed lines.
The table below compares the three approaches on a production line.
| Dimension | Retrospective approach | AI-led approach | |
|---|---|---|---|
| Timing | Year-end chart chase | Year-round, starting early in the measurement year | |
| Prioritization | All open gaps treated alike | Gaps ranked by how likely they are to close | |
| Data used | Claims and a sample of charts | Claims, clinical notes, lab results, and health information exchange feeds | |
| Outreach | Generic reminders | Member-specific, in the member’s language | |
| Audit readiness | Manual reconstruction | Lineage from source to measure | |
How to Deploy Computer Vision Quality Control: A Six-Step Checklist
Most stalled computer vision quality control deployments fail on fundamentals set in the first two weeks, not on model choice. Work the sequence in order.
Step 1: Define the Defect and the Cost of Missing It
Write down what pass and fail mean in physical terms, and attach a cost to each escape. A scratch that fails a medical housing and a scratch that fails a boat fitting are not the same decision, and the model is only as clear as that definition.
Step 2 : Fix the Imaging Before the Model
Resolution, lens, working distance, and above all lighting decide whether a defect is visible to the sensor at all. Controlled lighting and consistent part presentation remove more error than any later algorithm tuning, so settle the optics and fixturing first.
Step 3 : Build a Labeled Dataset That Reflects the Line
Collect images of good and defective parts across the real range of shifts, materials, and lighting, and label them with the people who own the quality standard. Rare defects are the hardest to gather and the most expensive to miss, so plan deliberate collection rather than waiting for them to appear.
Step 4 : Choose the Model Approach and Where It Runs
Match the method to the problem, using supervised detection for known, describable defects and anomaly detection where faults are rare or ill-defined, and score parts at the line for speed and data control. On-line scoring keeps pace with production and keeps sensitive part data inside the plant.
Step 5 : Integrate With the Line and Business Systems
A pass or fail signal is only useful if it drives an action, whether a reject arm, an operator alert, or a logged record. Wiring results into the Manufacturing Execution System (MES) and the Enterprise Resource Planning (ERP) system turns inspection into traceable quality data and ties a defect back to the batch, machine, and shift that produced it.
Step 6 : Validate, Monitor, and Plan to Retrain
Prove the system against known samples before it gates real production, then watch for drift as parts, materials, and cameras change over time. A model that was accurate at go-live decays quietly without monitoring and periodic retraining.
On the high-mix, lower-volume lines common in Florida aerospace and medical device work, steps three and six carry the most weight, since every new part variant reopens the dataset and validation questions.
How to Calculate Computer Vision ROI in Manufacturing
The computer vision ROI (Return on Investment) in a manufacturing setting comes from a few specific places, and it helps to name them rather than quote a single payback figure.
The largest is usually the cost of escapes avoided : the returns, warranty exposure, and containment events a missed defect sets in motion downstream. Earlier detection reduces scrap and rework, because a fault caught at the station that created it wastes far less material and labor than one caught at final assembly. In most rollouts, the first recovered cost is the drop in escaped defects on the highest-value parts, followed by scrap savings once detection moves upstream to the station of origin.
Two further effects show up over time. Inspectors move from repetitive scanning to handling the genuinely ambiguous cases the model flags, a better use of scarce skilled labor. And the decision record the system produces becomes an audit trail that carries real weight in regulated Florida sectors such as medical devices and aerospace.
ROI tracks the cost of your defects and your production volume, so the honest first move is to model your own numbers against the checklist above before committing to a line-wide rollout.
Price the deployment over its life rather than at go-live alone, since labeling, revalidation, and periodic retraining are recurring costs a fair proposal names up front. That same modeling answers the tool question: the right system for defect detection in 2026 is the one that fits your defect, your throughput, and your integration reality, not the one with the longest feature list.
What Should Florida Manufacturers Look for in a Computer Vision Partner?
The most challenging aspects of a deployment are imaging, labeled data, and the integration into systems that were never meant to receive a vision signal.
This is where a services partner earns its place, and where evaluation criteria matter more than a spec sheet: relevant defect and sector experience, a clear labeling and validation method, and the ability to connect inspection to MES and ERP rather than leaving a camera stranded on the line.
Intuceo, a Jacksonville-based AI and data engineering services firm, helps businesses with computer vision as one capability inside a broader manufacturing and data practice. Its work applies machine learning to MES and sensor data to identify process variances and defect signatures before parts are produced, which places inspection inside the wider quality picture rather than only at the end of it. In Intuceo’s lens defect detection work, high-speed vision models reduced manual QA workload by up to 30 percent while increasing inspection accuracy.[3] Those systems run on Intuceo-Dx, its pre-built computer vision and document intelligence accelerator within the Modular AI suite.
For Florida manufacturers weighing a first computer vision quality control deployment or a wider rollout, the practical next step is a scoped assessment of one line against the checklist above.
Scope your first inspection line, not a year-long program
Map one line to a deployment plan: defect definition, imaging, data, integration, and a defensible ROI case, before you commit capital across the floor.
Frequently Asked Questions
1.What is the ROI of computer vision quality control in manufacturing?
The ROI of computer vision quality control comes mainly from escapes avoided, meaning the returns, warranty exposure, and containment costs a missed defect triggers downstream, plus reduced scrap and rework from catching faults at the station that caused them, and a better use of skilled inspectors. No single payback figure transfers across plants, so the sound approach is to model one line against your own defect costs and volume before scaling.
2.How do I deploy a computer vision inspection system on the factory floor?
Deploy a computer vision inspection system in six steps: define pass and fail in physical terms, fix the imaging and lighting, build a labeled dataset that reflects your real production range, choose a model approach suited to your defects, integrate results into the line and your MES and ERP systems, then validate against known samples and monitor for drift. The imaging and data steps decide most outcomes, so resist starting with the model.
3.What cameras and sensors are best for AI-powered visual inspection?
The best sensor is the one that makes your specific defect visible, which is a function of defect size, surface, and line speed rather than raw megapixels. Area-scan cameras suit discrete parts, line-scan suits continuous or cylindrical material, and 3D or specialized sensors handle depth, gloss, or sub-surface issues. Lighting and lens choice usually matter more than the camera body.
4.How does computer vision integrate with existing MES and ERP systems?
Computer vision integrates with MES and ERP systems by passing each inspection result as structured data to the Manufacturing Execution System, which links each pass or fail to the batch, machine, and shift, and onward to the ERP system for quality, traceability, and cost reporting. Integration usually runs through the MES layer or an intermediate connector, and it is what converts a camera’s verdict into quality data the business can act on.
5.Is computer vision more accurate than manual inspection?
It is more consistent. Trained inspectors are estimated to miss 20 to 30 percent of defects depending on experience and fatigue, while an automated system applies one standard to every part and every shift and logs each decision. Accuracy still depends on imaging, labeled data, and ongoing monitoring.