Prediction Tells You What Will Happen. It Won’t Tell You What to Do.

Predictive and explainable models stop at the score. The capability that changes outcomes is prescriptive: knowing which factors a team can act on, and the shortest path from a bad outcome to a better one.
Health systems can now flag, with reasonable accuracy, which patients are likely to return within 30 days of discharge. The models work. The readmission rate has not moved with them. The 30-day all-cause readmission rate held at about 13.9 per 100 index admissions between 2016 and 2020, reaching 17.0 per 100 for Medicare patients.1 A prediction arrived. The outcome stayed the same.
The reason is rarely the model. It is the gap between knowing what will happen and knowing what to change.

Prediction stalls at the score

Most machine learning systems are built to answer one question. What will happen? This customer will churn. This loan will default. This patient will be readmitted. That answer is useful, and it is also where most systems stop.
Decision-makers cannot act on a probability. A clinical director looking at a readmission score still needs several things that the score does not provide. Why is this patient at risk? Which of the contributing factors can the care team actually influence? What is the smallest change that would lower the risk? And of all the available options, which is the shortest, most feasible route to a better outcome?
A risk score answers none of these. It ranks cases. It does not specify what action needs to be taken. The result is a model that earns its place in a report and never reaches the call list, the discharge plan, or the workflow where the decision gets made.

Explanation is not the same as action

Explainable AI was supposed to close this gap. It helps, but it does not finish the job. Feature attribution tells a team which variables are associated with an outcome. It says that low engagement and unresolved complaints correlate with churn, or that prior admissions, medication complexity, and social factors correlate with readmission.
Knowing what is associated with an outcome is not the same as knowing what to do about it. A real decision system has to separate several different kinds of attributes:
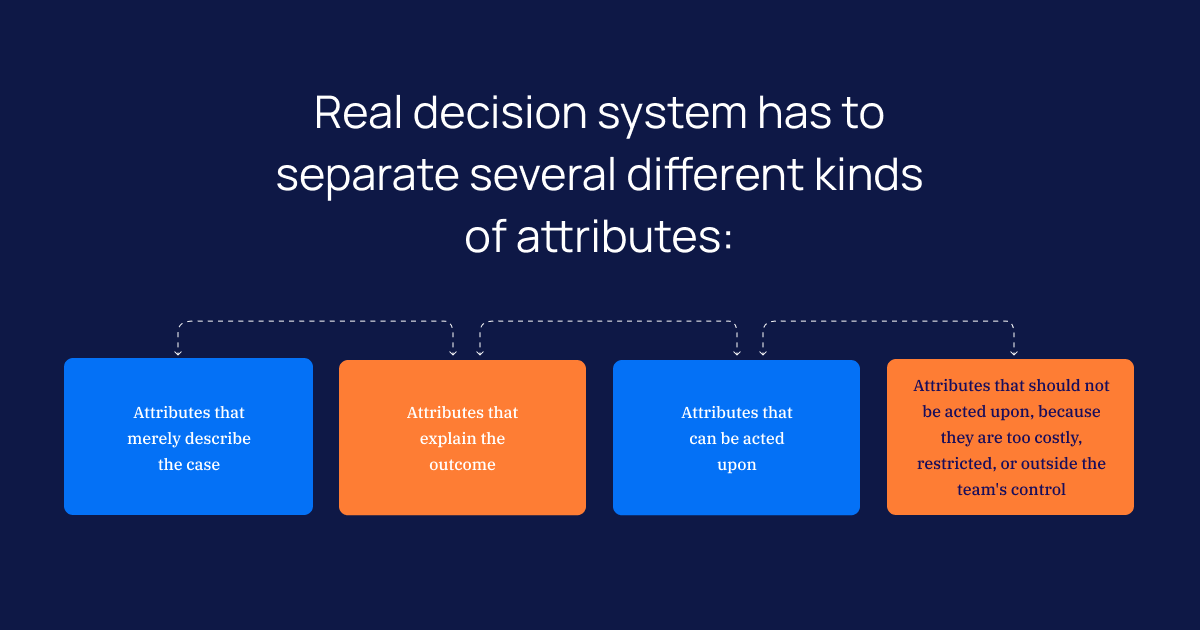
A patient’s age explains readmission risk, and it cannot be changed. A medication reconciliation step at discharge also influences risk, and it can be changed this afternoon. An explanation that treats both as equally important sends the team nowhere. The intelligence is in the distinction.

What prescriptive intelligence actually requires

The capability that closes the gap is prescriptive. It does more than score and explain. It identifies the specific, feasible changes that move a case from an undesired state to a desired one, and it ranks those changes by impact, effort, and constraints.
Three things have to work together for that to happen. Rule extraction pulls the decision logic out of high-dimensional data instead of leaving it locked inside a black box. Actionable attribute selection separates the factors a team can change from the ones it cannot. Shortest-path reasoning finds the minimal set of changes that produces the result, rather than handing over a list of fifty possible interventions.
That last point carries more weight than it first appears. Decision-makers do not want a hundred recommendations. They want the smallest change that moves the needle: the one process fix that prevents a delay, the single follow-up that keeps a patient out of the hospital, the behavioral shift that moves a case into a safer class. Listing every possible intervention is easy. Ranking the feasible ones by what they cost and what they return is the hard part, and it is where the value sits.

A worked example: the high-risk patient

Illustrative scenario

A discharge planner looks at a patient the model has flagged as high-risk for readmission. An explanation layer lists the drivers: multiple chronic conditions, a complex medication regimen, a missed prior follow-up, and limited transport to appointments.
The planner still has to decide what to do before the patient leaves. Several of those drivers are fixed. The chronic conditions are not changing this week. But the medication regimen can be reconciled and simplified now. A follow-up can be scheduled and confirmed. A transport barrier can be answered with a referral.
A prescriptive system does not stop at the four drivers. It identifies which are modifiable, which are feasible given the team’s resources, and which combination forms the shortest path to a lower risk. That is the difference between a model that produces a number and a system that produces a decision.

Why prescriptive paths are also a governance asset

In regulated industries, a recommendation is only useful if it can be defended. A clinical or compliance reviewer has to ask whether a recommendation is justified, whether it can be audited, whether a domain expert would validate it, and whether it is fair and operationally feasible.
Black-box predictions struggle with every one of those questions. A transformation path does not. Because it is built from extracted rules and a stated sequence of changes, it can be inspected, challenged, and approved before anyone acts on it. The same structure that makes a recommendation useful to a care team is what makes it defensible to a regulator. In healthcare, life sciences, and other high-stakes settings, that is not a feature. It is a requirement.

From prediction to prescription

The lesson holds across every model an enterprise runs. A predictive model says something is likely to happen. An explanatory model says which factors are associated with it. Neither tells the organization what to change, in what order, with the least effort, to improve the outcome. That last step is where measurable value lives.
This is the principle behind Intuceo’s approach to decision intelligence. The Intuceo-Ax engine pairs prediction with a Rationalization Layer that surfaces the statistical evidence and logic behind a recommendation, instead of a yes or no answer. In adverse event reporting and risk stratification, that means a model does not just predict, it justifies, which is what regulatory frameworks like GxP and HIPAA demand. The work is delivered as explainable, governed systems, built and validated through the iPDLC development framework, rather than a black box dropped into a workflow.
Prediction was never the finish line. The organizations that see returns from AI are the ones that treat the score as the start of a decision, not the end of one.
There is a harder question waiting in the GenAI era. If models like GPT and Claude can reason and explain so fluently, why can’t they deliver this structured, auditable path on their own? That is the subject of the next post.

Turn predictive models into decisions your teams can act on.

Intuceo builds explainable, governed decision intelligence for healthcare, life sciences, and other regulated industries.

Frequently Asked Questions

Predictive analytics estimates what is likely to happen, such as which patients may be readmitted or which loans may default. Prescriptive analytics goes further. It identifies the specific, feasible changes that move a case toward a better outcome, then ranks them by impact, effort, and constraints, so teams know what to do, not just what to expect.
Explainable AI shows which factors are associated with an outcome, but association is not action. A useful system also has to separate the factors a team can change from those it cannot, such as a patient’s age versus a discharge medication review. Prescriptive intelligence adds that distinction and finds the shortest path to a better result.
Yes, when the recommendation is built from extracted rules and a stated sequence of changes rather than a black-box score. That structure can be inspected, challenged, and validated by a domain expert before anyone acts, which is what frameworks such as HIPAA and GxP require. A transparent rationalization layer makes the recommendation defensible, not just accurate.

Managed Analytics as a Service: The Definitive Guide for Enterprise Health Systems

Enterprise health systems sit on more data than almost any other industry, and use far less of it than they should. One widely cited estimate suggests roughly 97% of the data generated by hospitals each year goes unused for analytics or evidence generation.The reasons are structural, not theoretical. Data is fragmented across electronic health records, claims systems, lab platforms, pharmacy benefit feeds, and increasingly social determinants of health. Pipelines break. Models drift. Compliance reviews stall releases. Analytics teams spend their week reconciling identifiers instead of producing insight.
This is the gap that managed analytics as a service is built to close. Instead of operating an in-house analytics stack as a permanent line item, health systems engage a specialist partner to design, run, and continuously improve their analytics environment as an outsourced service, with outcomes governed by a service level agreement and a defined value contract.
This guide is a complete reference for health system leaders evaluating healthcare analytics services. It covers what managed analytics actually is, where it differs from in-house builds, how compliance and EHR integration get handled in practice, what real outcomes look like in revenue cycle and quality of care, and how to evaluate providers without falling into a generic procurement checklist.

What Is Managed Analytics as a Service in Healthcare?

Managed analytics as a service is a delivery model in which an external partner owns the operating responsibility for a health system’s analytics stack. The partner is responsible for the data engineering, modeling, dashboards, monitoring, governance, and continuous tuning that turn raw clinical and financial data into decisions. The health system retains ownership of the data, the strategy, and the clinical context. The partner is accountable for uptime, accuracy, throughput, and measurable outcomes.
In a typical engagement, the scope spans:
This is structurally different from buying a one-off tool. A health system analytics platform sold as a license still requires the organization to staff data engineers, ML specialists, and compliance reviewers. Analytics as a service healthcare bundles the platform, the people, and the operating model into a contracted outcome.

Why Health Systems Are Moving to a Managed Model

The shift is being driven by four pressures that show up on every CIO and CMIO’s quarterly review.
The market is consolidating around outcome-led analytics. Enterprise spending is shifting from analytics software licenses toward operated services that carry contracted outcomes. Health systems that bought platforms expecting them to drive results are now finding that operating those platforms at scale is a different problem from buying them.
The talent equation does not work in-house for most systems. Healthcare data scientists are scarce, expensive to retain, and clustered around a small number of large academic systems. Building a competent in-house team capable of predictive analytics healthcare, clinical decision support analytics, and real-time healthcare analytics requires combining clinical informatics, ML engineering, cloud security, and regulatory expertise. Most provider organizations cannot maintain all four disciplines at depth.
The revenue side is leaking faster than internal teams can plug it. Initial claim denial rates reached 11.8% in 2024, up from 10.2% only a few years earlier, with denials from Medicare Advantage plans spiking 4.8% between 2023 and 2024. Health Catalyst estimates that 86% of denials are avoidable, yet most organizations cannot operationalize that insight at scale.
Clinical risk is now a data problem. The window to intervene in patient care has shrunk from weeks to minutes, and lagging retrospective reports are no longer enough to prevent adverse events. Health systems are penalized heavily when they fail to track rising-risk patients or miss soaring readmission rates. Managing this clinical risk requires continuous data orchestration, not static software. Health systems that operate analytics as a managed service are the ones moving fastest into predictive readmission management, population stratification, and proactive care gap closure.

In-House Analytics vs Managed Analytics as a Service

Dimension In-house analytics Managed analytics as a service
Time to first production model 12 to 24 months, including hiring 8 to 16 weeks for first use cases
Cost structure Capex heavy, fixed headcount Opex, scalable with usage
Talent risk Single points of failure on key engineers Diversified across partner bench
Compliance posture Maintained internally, audit by exception Continuously maintained, audit-ready
Innovation cadence Quarterly releases at best Continuous, model retraining built in
Clinical and domain context Strong, sits inside the organization Needs deliberate partner alignment
The right answer is rarely all-or-nothing. Many enterprise systems retain a small internal team focused on clinical strategy, governance, and domain ownership, and contract the engineering, ML operations, and compliance scaffolding to a managed partner. This protects clinical authority while offloading the operating burden.

The Core Capabilities of a Managed Healthcare Analytics Engagement

A serious analytics as a service healthcare engagement is not a dashboard refresh. It is an operating model that covers five interconnected capability layers.

1. Healthcare Data Integration and the Unified Patient Record

The first hard problem in any health system analytics program is fragmentation. Patient data lives in Epic or Cerner, payer claims sit in a separate system, lab results stream from external partners, pharmacy data flows through a PBM, and SDoH signals arrive through community health platforms. A managed partner is responsible for ingesting these sources, resolving identity across them, and producing a governed unified patient record.
Mature healthcare data integration services rely on HL7 and FHIR pipelines, master patient index logic, and lineage tracking that survives audit. Without this layer, every downstream model inherits the same identity and data quality problems. Healthcare data management services in a managed engagement also include retention policy enforcement, PHI tokenization where appropriate, and a clear data classification scheme that governs which datasets are accessible to which downstream models.

2. Clinical Decision Support and Patient Outcomes Analytics

Once the data layer is governed, the engagement moves into clinical decision support analytics and patient outcomes analytics. This is where predictive risk scoring, deterioration prediction, sepsis early warning, and chronic disease trajectory modeling live. The work is judged on whether clinicians actually use the output at the point of care, not whether the model achieves a particular AUC in a notebook. Outcome models that sit in dashboards without an integrated workflow rarely move clinical metrics. The ones that do are wired into discharge planning, care management queues, and order entry, so the prediction shows up at the moment a clinician can act on it.
The most cited outcome in this category is readmission reduction. 

3. Population Health and Risk Stratification

A population health analytics platform identifies high-utilizer cohorts, stratifies risk across panels, and feeds care management workflows. The capability set includes Clinical Risk Group classification, gap-in-care identification, SDoH overlay, and longitudinal cohort tracking. The output is operational: which 200 members in a 50,000-life panel deserve outreach this week.

4. Revenue Cycle and Financial Analytics

Revenue cycle management analytics is where managed analytics shows ROI fastest, because the denial problem is large and the feedback loop is short.

5. Quality Reporting and Regulatory Analytics

Enterprise health systems live with overlapping quality programs. Healthcare quality metrics reporting for HEDIS, AHRQ, and CMS measures cannot be a quarterly fire drill. A managed engagement maintains the measure logic, runs AHRQ measures reporting and CMS quality measures analytics continuously, and surfaces drift in performance before reporting cycles close. This is where Star Ratings and value-based contracts are won or lost.

HIPAA, FISMA, and the Compliance Imperative

Compliance is the single biggest reason that healthcare analytics fails the procurement test. IBM Security’s 2024 Cost of a Data Breach Report, as referenced across industry analysis, places the average cost of a healthcare data breach at USD 9.77 million, the highest of any industry for the twelfth consecutive year.
A serious managed analytics engagement treats HIPAA compliant analytics solutions as foundational rather than additive. That means:
The principle is straightforward. The cost of compliance is engineered in at the architecture layer, not patched on after the model is built.
The shift to cloud-based healthcare analytics has changed the economics here. Cloud-native lakehouse architectures on Azure, AWS, or Databricks make it possible to scale storage and compute against unpredictable clinical and claims volumes without overbuilding hardware. They also give compliance teams better tools, including continuous control monitoring, infrastructure-as-code audit trails, and native identity governance. The on-premise option still applies for federal workloads and certain payer environments, but the default for new engagements is increasingly cloud-first.

EHR Integration: The Realistic Picture

One of the most common questions in any analytics evaluation is how difficult it is to integrate a health system analytics platform with Epic, Cerner, or Meditech. While the technical integration is solved, the organizational integration is where projects slow down.
On the technical side, HL7 v2 and FHIR R4 are mature standards. Bulk FHIR APIs are now available across major EHRs. A managed partner with a tested ingestion framework can stand up structured feeds in weeks. Real-time healthcare analytics over HL7 streams is operationally feasible today, not a future-state aspiration.
The work that actually consumes time is governance: agreeing on which fields flow into the analytics environment, who approves PHI access, how identifiers are resolved across systems, and how clinician workflows surface model output without adding alert fatigue. A capable partner runs this work in parallel with the technical build.

How to Evaluate Managed Analytics Service Providers

Most procurement scorecards for enterprise health analytics miss the metrics that actually predict success. A more useful evaluation framework looks at five categories.

1. Domain depth, not just technology coverage

Ask the partner to walk through three healthcare-specific implementations in detail. If they cannot describe the clinical or actuarial logic behind the models, the engagement will stall when domain nuance enters the conversation.

2. Compliance posture as an engineering property

Ask for the architecture diagram of a HIPAA-validated environment they currently operate. Ask how they handle 21 CFR Part 11 where relevant. Vendors who treat compliance as a checkbox will produce checkbox-grade controls.

3. Operating metrics they will commit to in writing

Useful SLAs include data freshness, model accuracy thresholds, time-to-resolution on broken pipelines, and tracked clinical outcome metrics. Activity metrics like “dashboards delivered” are not operating metrics.

4. Explainability and auditability of model output

Clinical and actuarial leaders will not adopt model output they cannot defend. Explainable AI, model documentation, and lineage tracking should be standard, not premium add-ons.

5. Engagement model fit

A managed engagement is multi-year by nature. The right partner will offer flexible commercial models, including fixed-outcome contracts, capacity-based engagements, and hybrid models where the system retains strategic ownership while operating burden shifts to the partner.

How Intuceo Architects Managed Analytics for Health Systems

Intuceo operates as a services and solutions firm focused on AI, ML, and data analytics for regulated industries, with healthcare and life sciences as a primary vertical. The work is built around three commitments that map directly to what a managed analytics engagement actually requires.
PhD-led engineering. Intuceo’s healthcare engagements are led by ML and analytics practitioners with domain experience across payer, provider, and life sciences workloads, and supported by certified engineers and data architects working across HIPAA, FISMA, 21 CFR Part 11, and GxP environments.
Proprietary IP that compresses delivery time. The Intuceo IP stack includes Intuceo-Ax for augmented BI and conversational analytics, Intuceo-Ix for knowledge and enterprise search across unstructured clinical data, iPDLC for the AI-assisted development lifecycle, and AgentCare AI for clinician-facing agentic workflows over EHR data. The iPDLC framework alone reduces implementation lead time by up to 40% on production engagements.
Outcome-anchored engagement models. Intuceo offers strategic team augmentation, fixed-outcome project contracts, and managed service SOWs, allowing health systems to match commercial structure to risk appetite. Engagements span the full capability stack, from payer intelligence and value-based care to provider clinical integration, revenue cycle optimization, and security and interoperability architectures on Azure, AWS, and Databricks.
Healthcare clients include Florida Blue, Guidewell Health, and UF Health, among others. The work is grounded in HEDIS, AHRQ, and CMS measure logic, predictive readmission modeling, claim denial prevention, and unified patient record engineering across Epic, Cerner, and SDoH sources.

Where Managed Analytics Pays Off: Real Outcome Categories

The strongest case for healthcare analytics services sits in three outcome categories that translate cleanly into board-level metrics.

Readmission reduction and avoidable utilization

Predictive readmission models embedded into discharge workflows have produced documented reductions in 30-day readmission rates and corresponding savings on Medicare’s Hospital Readmissions Reduction Program penalties. The 11.4% to 8.1% pilot reduction documented in a regional hospital implementation is representative of what is achievable when the model is integrated into clinical workflow rather than delivered as a standalone dashboard.

Claim denial prevention and revenue cycle optimization

With initial denial rates at 11.8% and 86% of denials estimated to be avoidable, predictive denial management is one of the highest-yield use cases for healthcare BI as a service.

Population health and value-based care performance

A population health analytics platform linked to active care management workflows is the operational backbone of HEDIS and Star Ratings performance. The financial impact compounds across quality bonus payments, MLR stabilization, and risk-adjusted revenue.

Implementation Timelines and Skills Required

Realistic timelines for enterprise health analytics engagements:
On the internal skills side, health systems engaging a managed partner need fewer ML engineers and more domain owners. The roles that actually drive value are a clinical analytics sponsor, a finance analytics sponsor, a data governance lead, and a compliance reviewer. The deep technical work sits with the partner.

Conclusion

The gap between what enterprise search tools deliver and what life sciences organizations actually need is not a minor inconvenience. It is a structural problem that affects research velocity, regulatory compliance timelines, and the quality of safety decisions. Keyword matching was built for general corporate content, not for the terminological density, structural complexity, and compliance rigor of clinical trial document retrieval and regulatory document search.
Closing this gap requires a shift to semantic search for life sciences, purpose-built for the domain, deployed in compliant environments, and architected to deliver traceable, contextual answers rather than keyword-matched links. For organizations ready to make that shift, the difference is not incremental. It is the difference between searching for information and actually finding it.

Talk to the team that architects managed analytics for some of the biggest names in the US healthcare industry.

Bring your priority use case, and we’ll walk through what an outcome-anchored engagement would look like in your environment.

Frequently Asked Questions

Evaluate domain depth in healthcare specifically, the maturity of the partner’s HIPAA and FISMA architecture, the operating SLAs they will commit to in writing, the explainability of their model output, and the flexibility of their commercial model. Generic analytics vendors with a healthcare tag will struggle on the compliance and clinical context dimensions.
In-house analytics gives the organization full control and tight domain context, but requires sustained investment in scarce talent and continuous compliance maintenance. Managed analytics as a service shifts the operating burden to a specialist partner under a defined outcome contract, while the health system retains data ownership and strategic direction.
For systems with multi-source data fragmentation, denial rates above 8%, or active value-based contracts, the answer is almost always yes. The combination of avoided denials, reduced readmission penalties, and faster time to insight typically outweighs the cost of the engagement within the first 12 to 18 months.
Reputable providers run on HIPAA-validated cloud environments with encryption, MFA, role-based access control, audit logging, and continuous compliance monitoring built into the architecture. For federal workloads, FISMA and NIST 800-53 alignment are added. For life sciences workloads, 21 CFR Part 11 controls are layered in.

The technical integration with Epic, Cerner, Meditech, and Allscripts is well-trodden through HL7 v2, FHIR R4, and bulk FHIR APIs. The work that determines project speed is governance: PHI access approval, identifier resolution, and clinical workflow design. A capable partner runs governance in parallel with the build.

A typical first production use case lands within 8 to 16 weeks. Full coverage across clinical, financial, and population health use cases is usually a 9 to 18 month roadmap, with continuous expansion thereafter.
Through predictive risk scoring at the point of care, embedded clinical decision support, care gap closure workflows, and continuous HEDIS, AHRQ, and CMS measure tracking. The published evidence base, including documented readmission rate reductions and 40% improvements in risk-adjusted readmissions indexes, supports the operating model.
Yes. Predictive readmission management is one of the most evidence-backed use cases in healthcare analytics consulting, with documented reductions in 30-day readmission rates and corresponding savings on Medicare HRRP penalties.
On the partner side, the engagement needs ML engineering, data engineering on cloud lakehouse platforms, clinical informatics, healthcare compliance, and BI development. On the health system side, the critical roles are a clinical analytics sponsor, a finance or revenue cycle sponsor, a data governance lead, and a compliance reviewer. Internal teams do not need deep ML expertise. They need domain ownership, willingness to operationalize model output into workflow, and the authority to enforce governance.
The most useful evaluation metrics combine operating performance with clinical and financial outcomes. Operating metrics include data freshness, pipeline uptime, model accuracy thresholds, and time-to-resolution on incidents. Outcome metrics include readmission rate movement, denial rate movement, HEDIS and Star Rating performance, and time-to-deployment for new use cases. Activity metrics like dashboards delivered or models trained are not evaluation criteria.

Predictive Analytics in Healthcare: How Providers Are Reducing Readmission Rates Before Discharge

In the era of value-based care, the hospital discharge is no longer the “finish line” – it is a critical transition point. For healthcare providers, the challenge has always been identifying which patients are likely to return within 30 days. Traditionally, this was a guessing game based on clinical intuition or static scoring systems.
Today, predictive analytics in healthcare is changing the narrative. By leveraging AI-driven insights before a patient even leaves the hospital, providers are moving toward a “preventative discharge” model, effectively reducing readmission rates and ensuring long-term patient recovery.

The High Stakes of 30-Day Readmissions

Hospital readmissions are a multi-billion-dollar challenge. Under the CMS Hospital Readmissions Reduction Program (HRRP), hospitals face significant financial penalties if their 30-day readmission rates for conditions like heart failure or pneumonia exceed national averages.
The stakes are highest in chronic disease management. Across various clinical studies, up to 86% of heart failure rehospitalizations could potentially be prevented through timely medical and social interventions.
However, beyond heart failure, readmission risks exist across the board:
The gap lies in the hospital’s ability to identify exactly which interventions are needed for which patient after their discharge.

The Strategic Role of Predictive Analytics in Modern Healthcare

Before diving into the mechanics of readmissions, it is essential to understand the broader shift predictive analytics represents. In the past, healthcare data was mainly used for backward-looking analysis, focusing on metrics from the previous month or quarter.
Predictive analytics flips the script by using historical data to forecast future events. It is an “early warning system” – by synthesizing massive volumes of data from Electronic Health Records (EHRs), wearable devices, and genomic sequences, predictive tools can identify subtle patterns that the human eye might miss. This shift enables:
By serving as a foundation for decision support, predictive analytics allows healthcare organizations to transition from a volume-based “fee-for-service” model to a value-based model centered on quality and efficiency.
It is important to note that these predictive tools do not replace clinical judgment; rather, they function as advanced Clinical Decision Support (CDS). By providing a clear evidence base for risk, AI empowers the multidisciplinary team to make the final call on a patient’s readiness for discharge, ensuring that technology serves as a co-pilot in the care journey.

How Predictive Analytics Identifies High-Risk Patients

The power of hospital readmission prediction today lies in its ability to process massive, disparate datasets in real-time. Traditional methods, such as the LACE index, focused on a narrow set of variables: length of stay, acuity, comorbidities, and emergency visits. Though useful, these models often lack the context of a patient’s life outside the hospital.
HowPredictiveAnalyticsIdentifiesHigh-RiskPatients

1. Unlocking Hidden Insights with NLP

Much of the most valuable patient data is “trapped” in unstructured clinical notes – the narrative observations made by nurses, social workers, and therapists. Machine learning readmission models now use Natural Language Processing (NLP) to scan these notes for red flags that structured data misses, such as mentions of cognitive decline, lack of caregiver support at home, or history of non-adherence. Predictive models synthesize narrative data to provide a multidimensional view of risk that far exceeds traditional scoring.

2. Identifying "Clinical Fragility" via EHR Trends

Rather than looking at a single lab result, AI models look at the velocity of change.

3. The Critical Lens of Social Determinants (SDOH)

A patient’s recovery is often dictated by social and environmental factors beyond the clinic – access to healthy food, transportation to follow-up appointments, and housing stability. SDOH-informed models integrate these external variables into the clinical risk profile.

Precision in Practice: The Intervention Framework

The 30-day window is historically difficult to manage because hospitals often enter a ‘data vacuum’ the moment a patient leaves the building. Predictive analytics bridges this gap by identifying which patients are most likely to face complications on Day 10 or Day 20, allowing providers to extend their clinical ‘line of sight’ into the home and prevent the silent relapses that drive readmissions.
To tackle readmissions, providers are using a three-tiered predictive approach that triggers specific clinical actions regardless of the primary diagnosis.

1. The Pre-Discharge Stability Check

AI models analyze real-time hemodynamics and lab trends. If the model identifies “subclinical instability” – where the patient looks fine but data suggests physiological stress – the system alerts the care team to delay discharge by 24 hours for further observation.

2. The Social Safety Net

For patients flagged as high-risk due to social factors (ROC-AUC 0.79–0.82), the system automatically triggers a “Transition of Care” (TOC) bundle. This includes “Meds to Beds” delivery and a confirmed home-health visit within 48 hours.

3. Predictive Resource Prioritization

Not every patient needs a daily follow-up call. Predictive models identify the top 10% of “ultra-high-risk” patients. By focusing labor-intensive monitoring on these individuals, hospitals maximize their resources while ensuring the most vulnerable have a digital safety net.

Real-Time Risk Scoring at Discharge: A Strategic ROI

Implementing real-time readmission risk scoring isn’t just a clinical win; it’s a strategic financial move.

Calculating the ROI

When hospitals deploy predictive tools to cut readmissions by 30-50%, the Return on Investment (ROI) is realized through:

The Intuceo Advantage: Turning Data into Action

At Intuceo, we understand that a prediction is only valuable if it is actionable. Our Augmented BI technology is designed to bridge the gap between “big data” and “bedside care.”

Conclusion: Predictive Care is the Future

The transition from retrospective management to predictive foresight is more than a technological upgrade – it is a fundamental reimagining of the hospital’s role in a patient’s life. In the traditional model, patient discharge was treated as a conclusion; however, in this digital-first world, it is an informed handoff supported by a continuous clinical safety net.
Reducing readmission rate is a complex puzzle with clinical, social, and behavioral pieces. However, by leveraging predictive analytics in healthcare, providers can finally visualize the “invisible” risks, from subtle lab velocity shifts and hidden social determinants to the nuances buried in clinical notes, that lead to relapse.
For Intuceo, the objective is to ensure that “big data” never loses its human context. By transforming raw Electronic Health Record data into actionable bedside intelligence, we empower providers to ensure that when a patient is discharged, they aren’t just leaving a facility – they are entering a managed recovery ecosystem. The future of healthcare isn’t defined by the events that occur within the hospital walls, but by the clinical intelligence that keeps patients healthy, at home, and on a definitive path to long-term wellness.

Ready to transform your discharge process from a guessing game into a managed recovery?

Frequently Asked Questions

The LACE index is a static, backward-looking tool that relies on only four variables. Predictive analytics, however, uses machine learning to analyze hundreds of real-time data points simultaneously—including “velocity of change” in labs and social determinants (SDOH). This allows AI to identify high-risk patients that the LACE index frequently misses, such as those who are clinically stable but socially fragile.
No. These tools function as Clinical Decision Support (CDS) systems. They act as a “co-pilot” for the clinical team by providing a data-driven risk score and explaining the underlying causes of that risk. The final decision to discharge remains with the physician and the multidisciplinary care team.
Yes. Through Natural Language Processing (NLP), predictive models can “read” the narrative notes written by nurses, therapists, and social workers. It identifies red flags like “patient expressed confusion about discharge instructions” or “home environment lacks caregiver support.” This converts subjective observations into objective risk data.
Machine learning models are not “set and forget.” As medical standards evolve (e.g., new heart failure protocols), the model must undergo periodic retraining. Advanced platforms use Continuous Learning loops to monitor if the model’s performance is dipping, ensuring that the risk scoring remains aligned with current clinical outcomes and the specific demographics of your local patient population.
Solutions like Intuceo’s DataSharp™ engine are designed to automate the preprocessing of complex EHR data. By embedding risk scores and insights directly into the existing clinical workflow, these tools provide real-time alerts without requiring clinicians to log into a separate platform.